Case study · Restaurant and retail

Finding where younger guests drop off

A heritage restaurant and retail chain was aging with its guests and could not measure where younger diners fell out. We rebuilt guest intelligence around RFM and velocity models, cohort funnels, and a unified Guest 360, then shipped a pilot kit to test fixes.

Restaurant and retailData StrategyAI Solutions
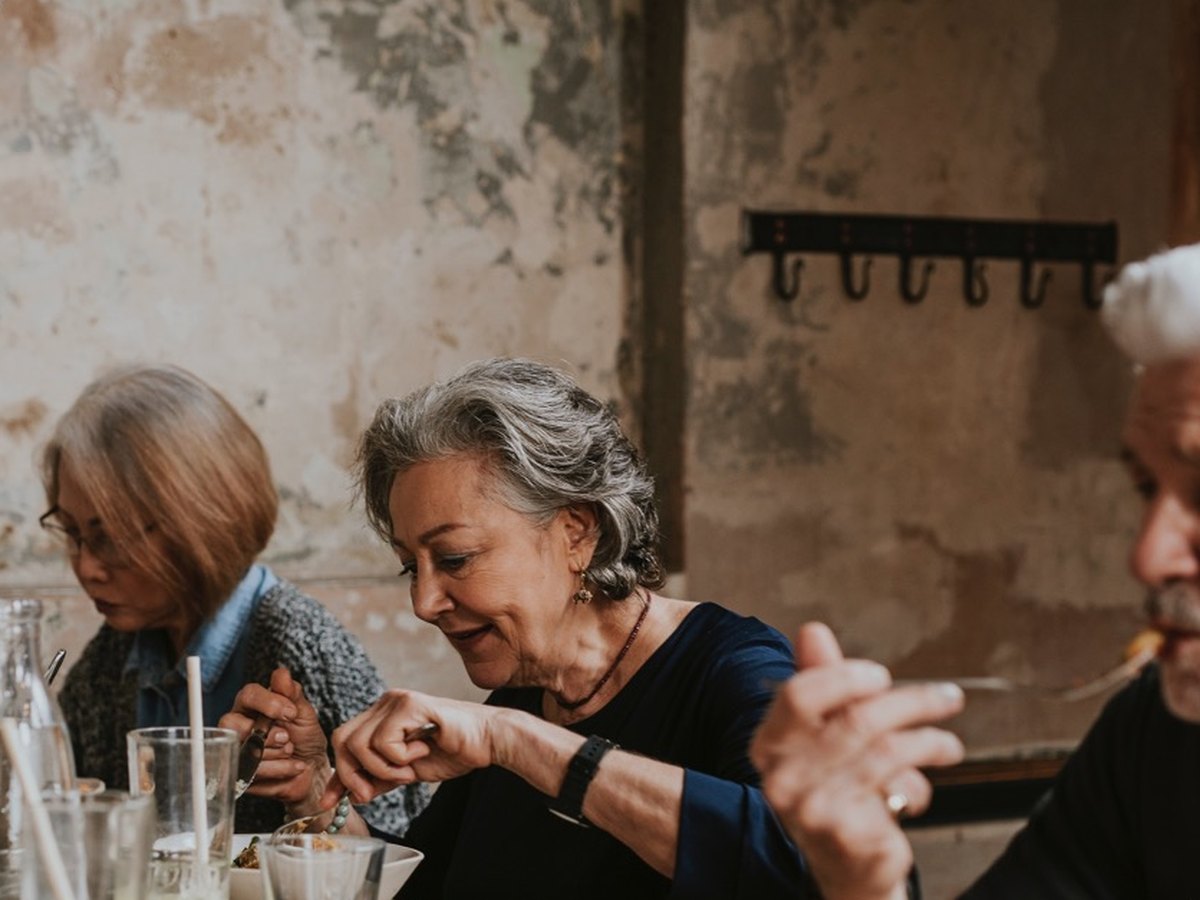
Guests sharing a meal together at a restaurant table

A guest-intelligence foundation that locates the youth conversion gap by market and moment, with a pilot kit to test offers against it.

At a glance

The challenge

Fragmented measurement across restaurant and retail behaviors limited precision on who was churning, why, and where to intervene.

Our approach

RFM and revenue-velocity models, trial-to-loyalty cohort funnels, trade-area mobility enrichment, NLP on survey and review text, and a unified Guest 360 baseline.

The result

A guest-intelligence foundation that locates the youth conversion gap by market and moment, with a pilot kit to test offers against it.

What we built

The work behind it

RFM and velocity segmentation

Models & Diagnostics

RFM and revenue-velocity models — revenue-per-day-since-registration, frequency momentum — exposing where younger guests appear, where they drop off, and which lifecycle segments are most age-skewed.

Cohort and lifecycle analytics

Cohort Dashboards

Trial, adoption, and loyalty funnels defined by behavior and age proxies, quantifying second-visit gaps for younger cohorts by daypart, party size, and channel, tracked in live dashboards.

Geospatial and mobility insight

Decision App

Trade-area mobility and lifestyle markers to localize the youth gap and prioritize college-adjacent and weekend-leisure markets for pilots, packaged into a lightweight Streamlit app for what-if scenarios.

Experience and brand signal mining

NLP Insight Pack

Text mining across survey and review data to separate heritage anchors — comfort, familiarity — from youth appealers such as speed, digital ease, and lighter options.

Offer, menu, and loyalty experimentation

Pilot Design Kit

Micro-offers for the trial-to-second-visit stage, lighter-comfort menu flags, and digital convenience nudges including wait-time transparency and order-ahead, with test plans and measurement templates.

Executive visibility and measurement

Unified Guest 360

Restaurant and retail behavior unified into a Guest 360 baseline supporting churn and LTV modeling, with segment health, funnel leakage, and pilot ROI surfaced in executive dashboards.

What changed

Before and after

BeforeAfter
Restaurant and retail behavior measured separately
A unified Guest 360 baseline supporting churn and LTV modeling
Churn understood in aggregate
Second-visit gaps quantified by daypart, party size, and channel
National view of the demographic gap
Trade-area mobility markers localizing the gap to specific markets
Survey and review text read anecdotally
Text mining separating heritage anchors from youth appealers
Offers launched broadly
A pilot design kit with test plans and measurement templates
The full story

The brand's guests skew old. Average guest age sits near 55, more than 60% of guests are over 45, and older guests account for a disproportionate share of visit frequency. Millennial and Gen-Z penetration runs materially below category norms, and younger diners who do try the brand convert from trial to repeat at a weaker rate.

The commercial risk in that is obvious. The harder problem was that nobody could say precisely where the loss happened. Measurement was fragmented across restaurant and retail behaviors, so the business could see a softening trend without being able to name the moment, the market, or the cohort where it started.

There is also a trap in fixing it. Nostalgia is what older guests come for, and younger diners expect speed, digital convenience, and selective modernization. Chase one and you can lose the other, which is why the mandate was to grow younger segments without alienating loyalists.

So we built measurement precise enough to intervene with. RFM and revenue-velocity models showed which lifecycle segments were most age-skewed. Cohort funnels quantified the second-visit gap by daypart, party size, and channel — a gap, not a vibe. Trade-area mobility enrichment localized it to college-adjacent and weekend-leisure markets worth piloting in, and a lightweight Streamlit app let the team run what-if scenarios like shifting value into youth-dense dayparts.

Text mining did the part numbers cannot. Separating heritage anchors from youth appealers in survey and review language gave a defensible answer to which edges could be modernized and which parts were the heart.

Underneath it all, restaurant and retail behavior was unified into a Guest 360 baseline, which is what makes churn modeling, LTV modeling, and scaled experimentation possible at all.

“Our guest mix is aging faster than our brand is evolving. We need hard proof of where younger diners fall out — and a way to fix it without losing who we are.”